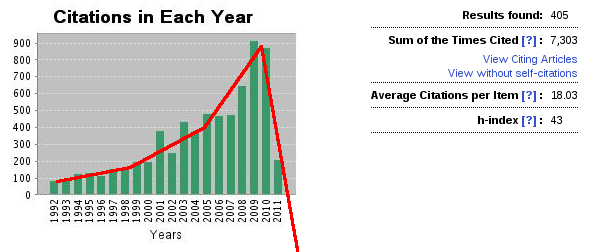

These are the predicted trends in Harry's h-factor. Analysis by Mathew Peet.
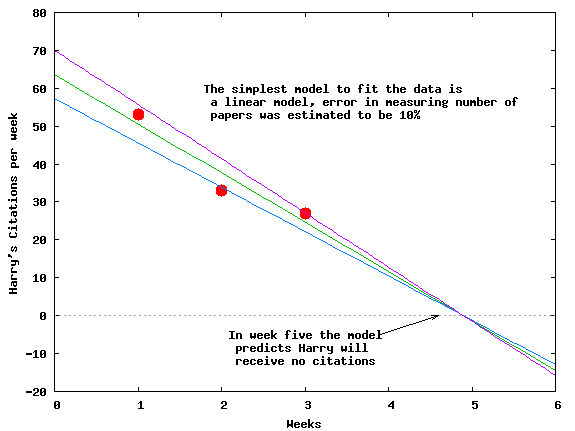
After suggestion that there was a trend in Harry's number of citations per week, an analysis was performed. For previous three weeks the trend has been 53, 33, 27. (these data in file.txt)
The red line is a linear neural network with 1 hidden unit (3 layer neural network). Activation function was f(x)= a + b(x). Optimisation was achieved using the nonlinear least-squares Marquardt-Levenberg algorithm (i.e. a straight line was fitted to the data points). Of course the work is only preliminary, but if we extrapolate the current trend...
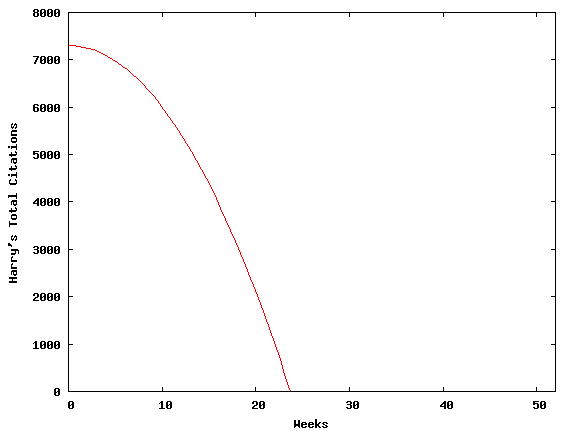
Harry would only reach h-index of 0 when he has been cited less than 0 times. Currently he has been cited 7,303 times. The current rate of decrease in citations is 13 +/- 4.041. Then it will take another 23 weeks before there are no citations at all. (not done iteratively, used f(x) = 7303 - 13 x^2.)
Web of knowledge also shows Harry has been cited far less times this year than last year.
*******************************************************************************
Fri Mar 25 12:36:26 2011


FIT:    data read from "file.txt" using 1:2
	x range restricted to [0.00000 : 6.00000]
        #datapoints = 3
        residuals are weighted equally (unit weight)

function used for fitting: f(x)
fitted parameters initialized with current variable values


 Iteration 0
 WSSR        : 4030              delta(WSSR)/WSSR   : 0
 delta(WSSR) : 0                 limit for stopping : 1e-05
 lambda	  : 1.68325

initial set of free parameter values

a               = 1
b               = 1

After 4 iterations the fit converged.
final sum of squares of residuals : 32.6667
rel. change during last iteration : -1.12792e-07

degrees of freedom    (FIT_NDF)                        : 1
rms of residuals      (FIT_STDFIT) = sqrt(WSSR/ndf)    : 5.71548
variance of residuals (reduced chisquare) = WSSR/ndf   : 32.6667

Final set of parameters            Asymptotic Standard Error
=======================            ==========================

a               = -13              +/- 4.041        (31.09%)
b               = 63.6667          +/- 8.731        (13.71%)


correlation matrix of the fit parameters:

               a      b
a               1.000
b              -0.926  1.000
| CML Home | Materials Algorithms |