Materials Science and
Technology 21 (2005) 1059-1062
Kinetics of the
crystallization of Ni–Zn ferrite powders prepared by the hydrothermal method
R. L. Mancera,*
G. Ridlová, Y. Wang & H. K. D. H. Bhadeshia
Department of Materials
Science and Metallurgy,
University of Cambridge,
Pembroke Street, Cambridge CB2 3QZ, United Kingdom
*Western Australian Biomedical Research Institute, GPO Box U1987, Perth WA 6845, Australia.
Abstract
Recently published data on the precipitation of
Ni-Zn ferrite powders prepared by the hydrothermal method have been analysed in
a manner consistent with Avrami theory.
The results indicate that the value of the time exponent is due to the
growth of spherical particles in a solution which becomes progressively
depleted of reactants. The
analysis also indicates that the process can be considered to be one in which
the particles all start growth from the initiation of the reaction.
Keywords: ferrite,
crystallization kinetics, Avrami theory, hydrothermal method
1. Introduction
Ferrites are a group of crystalline ceramic materials composed of iron oxide in combination with some other metal(s). They are used in magnetic, electronic and microwave devices due to their high magnetic permeability [1].
Spinel-type ferrite powders can be prepared by
a variety of methods [2-7], including the hydrothermal method, which utilizes
aqueous solvents under pressure and at temperatures above the normal boiling
point of water in order to speed up the reaction between solids [8,9]. The basic mechanism for the
hydrothermal formation of ceramic oxide particles involves a
dissolution/precipitation mechanism.
As the precursors (such as hydroxides) of component oxides are heated,
their solubility increases. Eventually, a sufficient concentration of the components
exists in solution to initiate formation of the more stable oxide phase. This process follows the general scheme
of Schikorr’s reaction [10]. The
driving force in these reactions is the difference in solubility of the oxide
phase from the least soluble precursor or intermediate. Reaction parameters such as the
solution pH, temperature and hydrothermal duration determine the nature of the
final products [5-9,11,12].
Recently Wang and Kung reported the use of the
hydrothermal method to promote the crystallization of nanosized powders of Ni0.5Zn0.5Fe2O4
spinel ferrites [13]. The
crystallization kinetics in the temperature range 100 °C to 150 °C
for different durations was investigated by X-ray diffraction (XRD). Using an empirical application of
Avrami theory, they reached the conclusion that the time-dependence of
precipitation can be explained in terms of nucleation alone. A crystallization activation energy of
56.2 kJ/mole was reported. Unfortunately, there are inconsistencies in their
analysis and interpretations, as described below. The purpose of the present work was to deal with these
difficulties and reach conclusions which are based on the mechanism of
precipitation. We begin with a
brief explanation of Avrami theory in order to set the scene.
2. Classical overall
transformation kinetics theory
The evolution of volume fraction during a
solid-state transformation is usually described using the classical
Kolmogorov-Johnson-Mehl-Avrami theory [14-18]. This theory makes use of the concept of extended volume to estimate the real volume
fraction of the phase transformation product when hard impingement between
growing particles is taken into account.
If unrestricted growth in the extended space is assumed, some particles
will grow in a region that has already been transformed. However only those particles that lie
in a previously untransformed region of the matrix can contribute to a change
in the real volume of the product phase (α):
|
|
(1) |
where V is the total volume, Vα is the volume of α and Veα is its corresponding extended
volume.
If we consider a simple case where the product
phase grows isotropically at a constant rate G and with a nucleation rate per unit volume IV, then the volume vτ of a particle nucleated at time t = τ is given by:
|
|
(2) |
We can then write the change in extended volume
over the time interval τ and τ
+ dτ as:
|
|
(3) |
If we then substitute the above into eq. (1),
integrate over time and rearrange we obtain the following expression:
|
|
(4) |
where x = Vα /V is the volume fraction of the product
phase. The above derivation has
been made with the assumptions of random nucleation, a constant nucleation rate
and a constant growth rate. Since
there are different possibilities we can express eq. (4) in a more general form
as:
|
|
(5) |
where kA and n are constants characterising the
reaction as a function of time, temperature and other variables. The values of kA and n can be obtained from experimental
data by plotting ln [-ln(1-x)] versus ln (t). The specific values of kA and n depend on the nature of nucleation
and growth. For example, a
constant nucleation and growth rate leads to a time exponent n = 4, while an exponent of n = 3 is obtained if it is assumed
that no nucleation is needed but the growth rate is constant [18].
3. Determination of the
kinetics of crystallization of nanosized Ni-Zn ferrite powders
Wang and Kung used the hydrothermal method to
produce ultrafine powders (between 10 and 20 nm in size) of Ni0.5Zn0.5Fe2O4
from solution nitrate precursors and used aqueous ammonia to obtain the desired
pH. The authors investigated the
crystallization of these powders at different pH, temperatures between 100 °C
and 180°C and process durations of up to 8 hours [13]. It was found that a single,
well-developed, spinel phase was obtained at an optimum pH of 9.0, which was
subsequently used in all other experimental determinations.
The XRD integral intensity of the (311) peak of the spinel phase was used to investigate the crystallization kinetics at 100 °C, 110 °C, 120 °C, 130 °C and 150 °C for process durations of up to 8 hours. Wang and Kang used the XRD intensity obtained at the longest duration (8h) and the highest temperature (180°C) to represent the maximum reaction expected; the fractions for other conditions were therefore derived by dividing the integrated intensity by that for the 180°C, 8h experiment. Henceforth all fractions (x) refer to the fraction normalised against the 180°C, 8h reference.
The general form of the empirical
Avrami transformation kinetic equation (eq. (5)) was used to evaluate the XRD
data. By taking logarithms and rearranging
eq. (5), it can be re-written in a linear form:
|
|
(6) |
where a plot of ln [-ln(1-x)] as a function of ln t yields the values of n and kA.
We have extracted the isothermal crystallization curves directly from Fig. 4 of reference [13]. The data are shown in Table 1 and Figure 1.
Fig. 1 shows that the maximum normalised fraction x of crystals at 150 °C is 0.7. This clearly indicates that at 150 °C and after 8 h the crystallization process has not reached a 100% transformation when compared against the reference (180°C, 8h, [13]). Furthermore, the levelling off of the curves at the lower temperatures of 120, 130 and 150 °C shown in Fig. 1, is rather odd given that the value of x is only about 0.5. This suggests that the composition (of precursors) in the matrix is in fact changing with time, which was not considered in the original analysis [13].
Fig. 2 shows the Avrami plots for
each of the temperatures investigated by considering eq. (6). The reported values of the n constant of 0.88 at 100 °C,
1.15 at 110 °C,
0.82 at 120 °C,
0.86 at 130 °C,
and 1.218 at 150 °C, giving a mean value of n = 0.99 [13].
From this result it was inferred that the only contribution to the time
exponent in the Avrami equation is from nucleation. This is unphysical since
growth obviously occurs and must contribute to the time exponent. However, it is evident that the
non-linear plots shown in Fig. 2 that the data do not fit the Avrami
equation. Linear regressions
on the data revealed rather different values of n from those reported [13]: 0.86 at 100°C, 0.84 at 110 °C,
0.50 at 120 °C,
0.39 at 130 °C,
and 0.39 at 150 °C. Our
analysis revealed that this is because the original analysis seems to have used
only the initial linear part of the plots, i.e. only the first three datapoints
(only two at 150°C) were used to determine n. It also
was found that in the derivation of the activation energy the ln kA value at the highest temperature (150 °C or
423 K) was omitted [13].
4. Re-evaluation of the
experimental data
It is clear from the data that
the precipitation reactions never go to completion, undoubtedly because the
concentration of reactants in solution changes during the course of the
reactions. As recent thermodynamic
calculations [19,20] indicate, the maximum extent of reaction is a function of
temperature, with solubility decreasing as the temperature increases. It follows that the crystallized fraction x must be normalized using the maximum
fraction possible at any temperature [18]. Therefore, the observed crystallized fraction x was divided by the maximum
crystallized fraction observed after 8 h at each individual temperature (the
data indicate that this is sufficient time to reach stasis, at least for the
120, 130 and 150 °C cases), as shown in Table 2 and Fig. 3.
Fig. 4 shows the corresponding Avrami plots for each of the temperatures investigated by considering eq. (6), which on the whole show the expected linear fit to the Avrami equation. The n values obtained are: 1.43 at 100°C, 1.49 at 110 °C, 1.72 at 120 °C, 1.25 at 130 °C, and 0.83 at 150 °C, giving a mean value of n = 1.34 ± 0.05. The data for 150°C are the most approximate given that there is a clear and unexplained change in slope as the reaction proceeds.
The growth of the ferrite powders
is controlled by the transport of solute, a process which must slow down as the
reaction proceeds and the reactants are depleted. In the absence of soft-impingement, each particle will
increase its size q in proportion to t1/2 [18]. The precipitate volume is proportional to q3 for spherical particles and hence is
proportional to t3/2. The actual time exponent may be
somewhat smaller than 1.5, particularly at the later stages of precipitation,
because the solute fields of different particles interact (i.e., soft
impingement occurs). Our
reanalysis indicates that n =
1.34, which is consistent with this growth mechanism, assuming that particles
start growth at time zero.
This interpretation indicates that the barrier to nucleation is negligible, which is possible if the initial mixture is impure. An examination of transmission electron micrographs reveals that the ferrite powders while not exactly spherical or uniform in shape [13], have morphologies consistent three-dimensional precipitate growth as assumed in eq. (2). More importantly, the micrographs also reveal that the growing particles are uniform in size, consistent with the conclusion that they all start growing from time zero.
The corresponding values of ln kA for each temperature are listed in Table 3, giving an activation energy EA = 57.4 ± 14.4 kJ/mole from the corresponding Arrhenius plot. This is essentially the same as that reported in [13], but the agreement is fortuitous since their reported value would have been 45.5 kJ/mole had they used all the data.
Our activation energy is significantly lower than the value of 329-353 kJ/mole reported for the solid state reaction formation of Ni-Zn-ferrites [21]. However, hydrothermal synthesis involves precipitation in a fluid, so it is not surprising that the activation energy is lower by an order of magnitude, and we speculate that it refers to the attachment of molecules to the growing particles.
5. Conclusions
Published data [13] on the precipitation of
Ni-Zn ferrite powders prepared by the hydrothermal method have been analysed in
a manner consistent with Avrami theory.
The results indicate that the value of the time exponent is consistent
with the growth of spherical particles in a solution which becomes
progressively depleted of reactants.
The analysis also indicates that the process can be considered to be one
in which the particles all start growth from the initiation of the reaction.
References
[1] A. Goldman, Handbook of Modern
Ferromagnetic Materials,
Kluwer, 1999.
[2] K. Tkácová, V. Sepelák, N. Stevulová, J. Solid State Chem. 123 (1996) 100.
[3] P.A. Lane, P.J. Wright, M.J. Crosbie, A.D. Pitt, C.L. Reeves, B. Cockayne, A.C. Jones, T.J. Leedham, J. Crystal Growth 192 (1998) 423.
[4] Z. Youcai, R. Stanforth, Miner. Eng. 13 (2000) 1417.
[5] J.H. Lee, C.K. Kim, S. Katoh, R. Murakami, J. Alloys Compounds 325 (2001) 276.
[6] W.J. Dawson, J. Am. Ceram. Soc. 67 (1988) 1673.
[7] P. S. Anil Kumar, J. J. Shrotri, C. E. Deshpande, S. K. Date, J. Appl. Phys. 81 (1997) 4788.
[8] S. Komarneni, E. Fregeau, E. Breval, R. Roy, J. Am. Ceram. Soc. 71 (1988) 26.
[9] C.K. Kim, J.H. Lee, S. Katoh, R. Murakami, M. Yoshimura, Mater. Res. Bull. 36 (2001) 2241.
[10] G. Schikorr, Z. allg. Chem. 212 (1938) 33.
[11] K. Byrappa, M. Yoshimura, Handbook of Hydrothermal Technology, Noyes 2001.
[12] K. Byrappa, Hydrothermal Growth of Crystals, Pergamon Press, Oxford, 1991.
[13] H.-W. Wang, S.-Ch. Kung, J. Magn. Magn. Mater. 270 (2004) 230.
[14] M. Avrami, J. Chem. Phys. 7 (1939) 1103.
[15] W.A. Johnson, R.F. Mehl, Trans. AIME 135 (1939) 416.
[16] M. Avrami, J. Chem. Phys. 8 (1940) 212.
[17] M. Avrami, J. Chem. Phys. 9 (1941) 177.
[18] J.W. Christian, Theory of Transformations in Metals and Alloys, Pergamon Press, Oxford, 1975.
[19] L. Xiang, Y.P. Yin, Y. Jin, J. Mater. Sci. 37 (2002) 349.
[20] T. Adschiri, Y. Hakuta, K. Sue, K. Arai, J. Nanoparticle Res. 3 (2001) 227.
[21] L.A. Bashkirov, M.G. Bashkirova, Vses. Soveshch., 1968, p. 216.
Figure Captions
Fig. 1. Isothermal crystallization curves at (a) 100 °C, (b) 110 °C, (c) 120 °C, (d) 130 °C, and (e) 150 °C [13].
Fig. 2. Avrami
plots of ln [-ln(1-x)] against ln t for isothermal crystallization.
Fig. 3. Normalized crystallization curves at (a) 100 °C, (b) 110 °C, (c) 120 °C, (d) 130 °C, and (e) 150 °C.
Fig. 4. Avrami plots of ln [-ln(1-x)] against ln t for the normalized crystallization data.
Figure 1
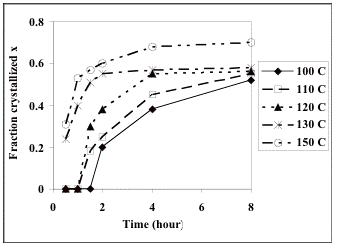
Figure 2
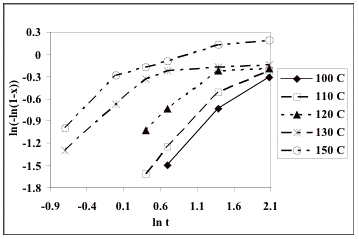
Figure 3
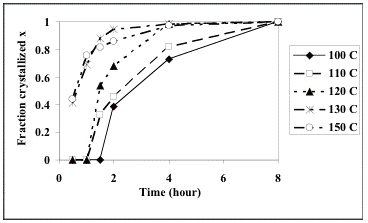
Figure 4
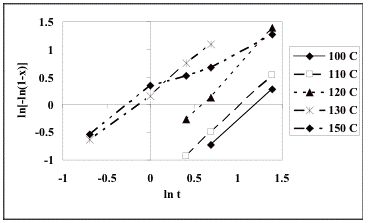
Table 1. Isothermal
crystallization data for the formation of Ni-Zn ultrafine powders.
|
Time (hour) |
Fraction crystallized x |
||||
|
|
100 °C |
110 °C |
120 °C |
130 °C |
150 °C |
|
0.5 |
0 |
0 |
0 |
0.24 |
0.31 |
|
1 |
0 |
0 |
0 |
0.4 |
0.53 |
|
1.5 |
0 |
0.18 |
0.3 |
0.51 |
0.57 |
|
2 |
0.2 |
0.25 |
0.38 |
0.55 |
0.6 |
|
4 |
0.38 |
0.45 |
0.55 |
0.57 |
0.68 |
|
8 |
0.52 |
0.55 |
0.56 |
0.58 |
0.7 |
Table 2. Normalized crystallization data
|
Time (hour) |
Fraction crystallized x |
||||
|
|
100 °C |
110 °C |
120 °C |
130 °C |
150 °C |
|
0.5 |
0 |
0 |
0 |
0.41 |
0.44 |
|
1 |
0 |
0 |
0 |
0.69 |
0.76 |
|
1.5 |
0 |
0.33 |
0.535714 |
0.88 |
0.8 |
|
2 |
0.39 |
0.46 |
0.678571 |
0.95 |
0.86 |
|
4 |
0.73 |
0.82 |
0.982143 |
0.98 |
0.97 |
|
8 |
1 |
1 |
1 |
1 |
1 |
Table 3. Values of ln kA for each crystallization temperature from the normalized data
|
T (K) |
373 |
383 |
393 |
403 |
423 |
|
ln kA |
-1.717 |
-1.530 |
-1.003 |
0.215 |
0.157 |