It is understood that fatigue crack growth is a consequence of the accumulation of damage by deformation in the plastic zone at the crack tip. At low loads the deformation is governed by the cyclic variation in the stress-intensity range ![]() . The crack extension per cycle
. The crack extension per cycle ![]() becomes measurable at a threshold
becomes measurable at a threshold
![]() , followed by the slower extension rate in the Paris Law regime [4,2,1,3] described by the proportionality
, followed by the slower extension rate in the Paris Law regime [4,2,1,3] described by the proportionality
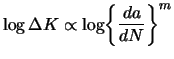 |
(1) |
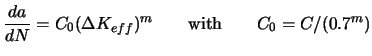
Elber modified the relation with an effective stress intensity range
![]() to allow for variable amplitude loading, arguing that cracks grow only when their tips are open [7]:
to allow for variable amplitude loading, arguing that cracks grow only when their tips are open [7]:
 |
(2) |
![$\displaystyle \frac{da}{dN} = \bigg( \frac{\pi}{32} \bigg)^{\frac{1}{2\eta}} \f...
... ) } \Big(1 - \frac{K}{K_{Ic}} \Big) \bigg]^{\frac{1}{\eta}} K^{\frac{2}{\eta}}$](img14.png) |
(3) |
The aim here was to exploit published fatigue crack growth data to create a model based on physical variables which are readily measured in a tensile test, rather than rely on inputs which depend on fatigue testing, and further, to include variables which account for test-specimen parameters. The model uses neural network analysis; although there are physically based models available in the literature, for example, [10], they require fitting parameters; a neural network is the most general way of achieving fitting without making prior assumptions about the relationship to which the data are fitted [11]. There have been other attempts to use neural networks for this purpose [12] but they do not adequately treat the uncertainties of modelling so it is not possible to properly assess the predictions made. The original intention here was to study steels, but as will be seen later, the model was, without modification, found to generalise to other alloy systems.